5G & Future Business Use Cases
5G-enabled New Vertical Market Applications
The Juniper Strategy Quadrant below illustrates the existing and new applications against the different enabling sectors in the IoT world that 5G will enable.
Figure 2: Strategy Quadrant: 5G and the IoT
Source: Juniper Research
(Click to Enlarge)
Operator Monetization Strategies
As noted in our previous edition, ARPU (Average Revenue per User) has been considered the benchmark metric for measuring operator success in terms of billed revenue. The new services discussed in the previous sections are expected to be heavily dependent on a favorable operator service model.
There is both a need and a desire to solve the ARPU problem that network operators are facing; carriers are considering different service scenarios that they could deploy to garner payback from their network license investments.
The challenge here, however, is that as 5G expected to drive a number of connected devices, systems and sensor networks, is ARPU going to be the right factor for measuring 5G? For example, consider M2M verticals:
Sector Usage Analysis
5G IoT Sector Data Traffic Analysis
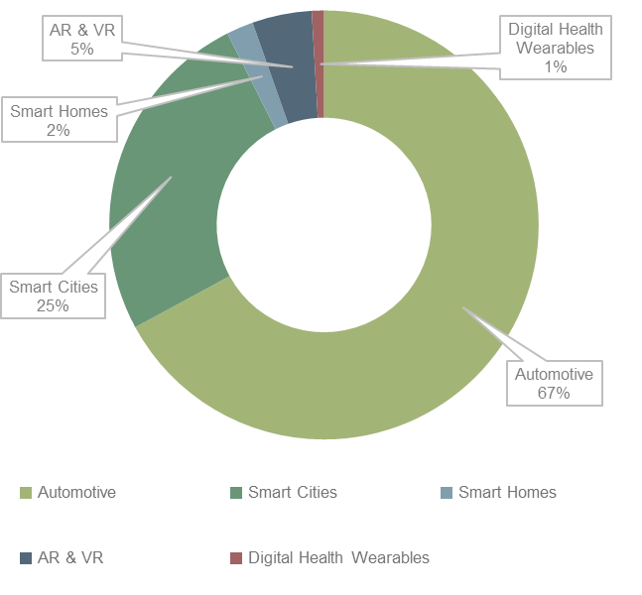
As shown in figure 3, automotive 5G connections will generate 68 percent of all data generated by 5G IoT connections. This in turn is driven by the high data generated by future AV (Autonomous Vehicle) systems. Juniper anticipates that a full AV could generate more than 1TB of data per day. Additionally, smart city technologies are anticipated to generate 30 percent of all data by 2025. In these instances, data will be driven by the public Internet gateways that connect city residents to the Internet and infrastructure management.
Figure 3: Proportional Sector Split of IoT Mobile Data Traffic Carried Over 5G Networks (PB), Split by 5 IoT Sectors in 2025 – 543 PB
Source: Juniper Research
(Click to Enlarge)


