The critical role of Active Assurance in the context of SDN and NFV
Fundamentals of Service Assurance:
Service assurance relies on two different measurement techniques to understand service performance; passive probing and active probing, and each brings its own value.
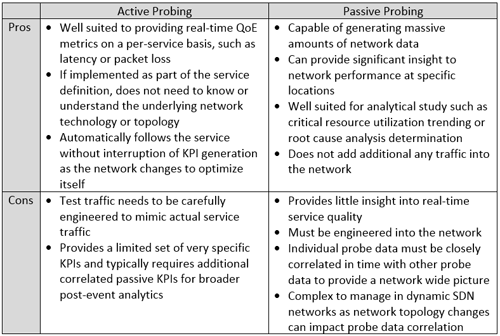
Passive probes monitor traffic flows as they traverse the network and generate KPIs or alarms accordingly. As the name suggests, these probes do not impact the services themselves or generate test traffic in the network. This kind of probing can be as simple as reading port level statistics available through SNMP MIBs, or may involve making a copy of the traffic (tapping the physical link or using a mirror port on a switch) and storing it for analysis (often by an external system or even manually by an engineer). Passive probes are engineered into the network at key points to provide very detailed information at that point to derive a wide range of information. For example, TCP headers contain information that can be used to derive network topology, identify services and operating systems running on networked devices, and detect potentially malicious probes. However, all of this requires network traffic to be present and a significant amount of computing and storage resources before any benefit can be realized.
Active probes, on the other hand, work by inserting synthetic test traffic into the network and observing how the network, service or other elements respond. By inserting synthetic test traffic into the service flow, the active probe can measure the performance of the service, end-to-end and in real-time, generating service level metrics such as latency, jitter, and packet loss. Because active probes are essentially a part of the service traffic, they do not need to be engineered into the network. Rather, they can be inserted at some point in the service flow without any knowledge of the service path. Active probing is ideal for generating real-time performance data on specific services with or without the need for customer traffic.
Is one better than the other? Do you need both? Well, it really depends on what you’re trying to do. In a traditional network, where the physical network was closely aligned to the service requirements, passive probing was adequate for managing the majority of services since networking metrics like bandwidth utilization or errored frames provided sufficient insight into service performance to allow network operations teams to manage issues as they arose – albeit, not in real-time. Active probing was typically reserved for high revenue services with performance based SLAs since violations of the service agreement could cost the service provider significant money or worse, the customer itself.
In a virtualized network, driven by SDN and NFV principals and fully automated to drive out OPEX and enable massive scale, continuous access to real-time service and network performance metrics is essential. The entire network operates as a closed loop control system where the feedback mechanism is service performance [See reference]. Passive probing is ideally suited for gathering massive amounts of historical network data and storing it for deep troubleshooting and analysis. Active probing, on the other hand, is ideally suited for creating real-time performance information on a service level, and for this reason, active probing is critical for virtualized networks.
Table 1 - Active versus Passive probes


